Build a widget that fetches birth year data from an API and display the data in a histogram, bucketing by the data by decades.
Requirements
- We'll use random.org's random number generator to simulate an API that returns 200 random data points from 1950 to 2019.
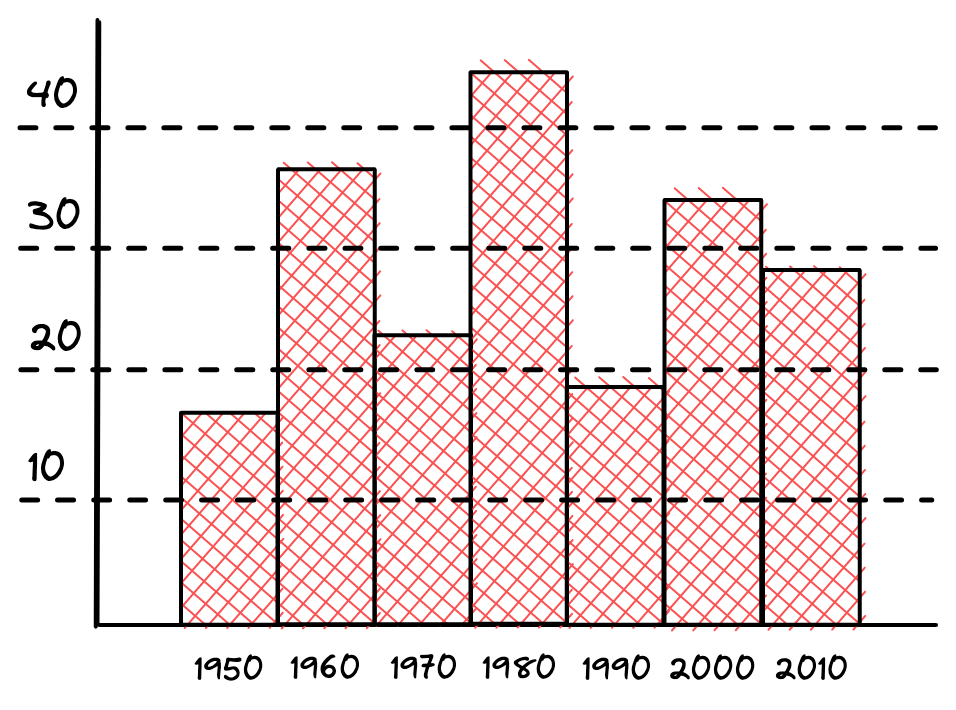
- Tabulate the data by bucketing the data by decades and plotting a histogram with the x-axis being the decade buckets and y-axis being the count.
- The y-axis should be appropriately labeled.
The example below shows a potential resulting histogram but you are free to style it.
Notes
- In practice, you are usually not required to tabulate the API response data. However during interviews this is a possible task as the act of writing code to tabulate data provides good signal on coding fundamentals.
Source
This question is adapted from FrontendEval's Data fetching and visualization question.
Solution
Solution
With most data fetching and display problems, the solution can be broken down into:
- Fetching data.
- Processing the data, if necessary.
- Displaying the data.